In January 2020, recognizing that climate-related risks and opportunities are an important management issue, Furukawa Electric Group declared its endorsement of the Climate-related Financial Information Disclosure Task Force (TCFD). In addition, based on the “Guidance on Metrics, Targets, and Transition Plans” published by TCFD in October 2021, we started formulating a climate transition plan which is a series of targets and actions to support the transition to a low-carbon economy in FY2023. We will promote disclosure in line with the TCFD recommendations to strengthen our relationships of trust with our stakeholders.

| Governance | Disclose the organization’s governance around climate-related risks and opportunities. | a) Describe the board’s oversight of climate-related risks and opportunities. |
|---|---|---|
| b) Describe management’s role in assessing and managing climate-related risks and opportunities. | ||
| Strategy | Disclose the actual and potential impacts of climate-related risks and opportunities on the organization’s businesses, strategy, and financial planning where such information is material. | a) Describe the climate-related risks and opportunities the organization has identified over the short, medium, and long term. |
| b) Describe the impact of climate-related risks and opportunities on the organization’s businesses, strategy, and financial planning. | ||
| c) Describe the resilience of the organization’s strategy, taking into consideration different climate-related scenarios, including a 2℃ or lower scenario. | ||
| Risk Management | Disclose how the organization identifies, assesses, and manages climate-related risks. | a) Describe the organization’s processes for identifying and assessing climate-related risks. |
| b) Describe the organization’s processes for managing climate-related risks. | ||
| c) Describe how processes for identifying, assessing, and managing climate-related risks are integrated into the organization’s overall risk management. | ||
| Metrics and Targets | Disclose the metrics and targets used to assess and manage relevant climate-related risks and opportunities where such information is material. | a) Disclose the metrics used by the organization to assess climate-related risks and opportunities in line with its strategy and risk management process. |
| b) Disclose Scope 1, Scope 2, and, if appropriate, Scope 3 greenhouse gas (GHG) emissions, and the related risks. | ||
| c) Describe the targets used by the organization to manage climate-related risks and opportunities and performance against targets. |
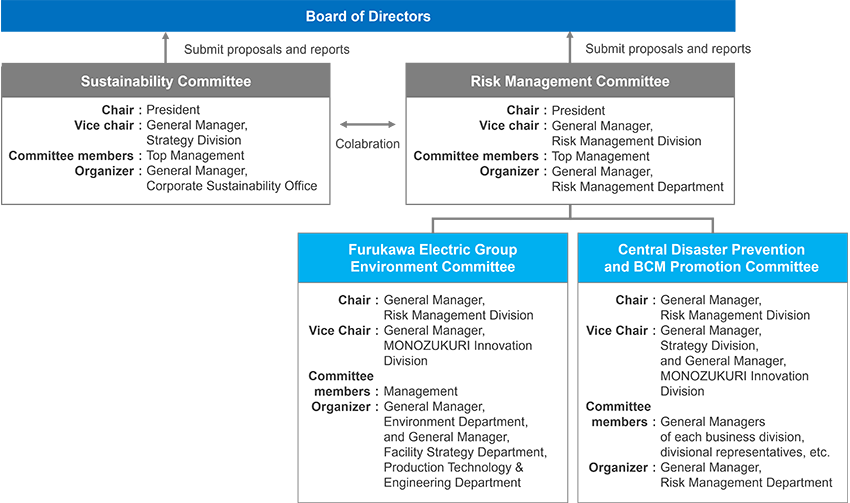
As issues on “Developing business activities that consider climate change,” risk-related material issues, are closely related to management strategy risks of Furukawa Electric Group, they are handled in collaboration with Sustainability Committee, Risk Management Committee, and its special committee, Furukawa Electric Group Environmental Committee (hereinafter, “Environmental Committee”) and Central Disaster Prevention and BCM Promotion Committee.
In considering climate-related risks such as those posed by climate change and natural disasters as the priority issue for environmental risk, we regularly discuss preliminary strategies for climate-related risks mainly at Environmental Committee and business continuity measures after the occurrence of risks are discussed mainly at Central Disaster Prevention and BCM Promotion Committee.
Environmental Committee, chaired by the General Manager of Risk Management Division and composed of top management including general managers of each business division and corporate division, meets every three months to discuss issues related to climate change among others, and submits proposals and reports to Management Committee and the Board of Directors.
Central Disaster Prevention and BCM Promotion Committee, chaired by the General Manager of Risk Management Division and composed of general managers of each business division, divisional representatives, etc., meets every three months to establish Business Continuity Management (BCM), identify business continuity risks, including natural disasters, and promote and manage the identification process.
Furthermore, the status of business execution on climate change is reported to and shared with the Board of Directors on a quarterly basis.
| Board of Directors | Feb. 2021 | Formulation of the FEG Environmental Vision 2050 |
|---|---|---|
| Nov. 2024 | Revision of the FEG Environmental Vision 2050 | |
| Management Committee | Jan. 2019 | Setting of the Environmental Targets 2030; application for an SBT (2℃ Targets) initiative certification |
| Jan. 2020 | Expression of support for the recommendations of TCFD | |
| Dec. 2020–Feb. 2021 | Formulation of the FEG Environmental Vision 2050 | |
| Nov. 2021–Feb. 2022 | Revision of the Environmental Targets 2030; application for an SBT (WB 2℃ Targets) initiative certification | |
| Nov.– Dec. 2022 | Revision of the Environmental Targets 2030; application for an SBT (1.5℃Targets) initiative certification; and purchase of a renewable energy certificate | |
| Nov. 2024 | Revision of the FEG Environmental Vision 2050 |
In order to show our “resilience of an organization’s strategy, taking into consideration of different climate-related scenarios, including a 2℃ or lower scenario” provided by TCFD recommendation, Furukawa Electric Group has identified climate-related risks (transition risks and physical risks) and opportunities and conducted scenario analysis related to different climates, including a “2℃ or lower scenario,” setting Medium-Term Management Plan as a baseline since FY2019.
Identification of climate-related risks and opportunities is conducted through a process of Step 1 through Step 3. First, in Step 1, we create a list of climate-related risks and opportunities, including not only in our Group but also in the upstream and downstream operations of supply chain by referring to “external information” and “internal information.” In Step 2, the identified items are evaluated with scores in terms of “impact on Furukawa Electric Group” and prioritized. In Step 3, high-priority items are identified as climate-related risks and opportunities. For the identified climate-related risks and opportunities, assessment of impact on business in FY2030 is conducted with impact parameters in a 1.5℃ scenario and a 4℃ scenario.
| 1.5℃ scenario | World Energy Outlook by the International Energy Agency (IEA)Net Zero Emissions by 2050 Scenario (NZE Scenario) |
|---|---|
| 4℃ scenario | Fifth Assessment Report (AR5) by the Intergovernmental Panel on Climate Change (IPCC) RCP8.5 Scenario |
| Short term | Up to FY2028 |
|---|---|
| Medium term | Up to FY2030 |
| Long term | Up to FY2050 |
| Category | Identified climate related risks and opportunities | Period to manifest | Business impact in 2030 | |||
|---|---|---|---|---|---|---|
| 1.5℃ | 4℃ | |||||
| Risks | Transition risks | Policies and regulations | ・Carbon tax on GHG emissions | Medium to long term | Major | Minor |
| Markets | ・Increase in procurement costs of renewable energy ・Increase in procurement costs of materials (copper, aluminum, plastics) due to carbon taxation |
Medium to long term | Major | Minor | ||
| Physical risks | Acute | ・Damage to buildings due to large-scale disasters (large typhoons, heavy rains, heavy snow, lightning strikes) caused by abnormal weather ・Supply chain disruption of customers or suppliers caused by weather disaster |
Medium to long term | Minor | Minor | |
| ・Shut-down of coastal factories caused by flooding and drought | Medium to long term | Medium | Major | |||
| Chronic | ・Increase in air conditioning costs due to a rise in average temperature | Medium to long term | Medium | Major | ||
| Opportunities | Markets | ・Increase in revenue and profit of related products driven by rising demand for reduced power consumption in data centers | Short to long term | Major | Major | |
| ・Increase in revenue and profit driven by growing demand for lightweight and high-voltage-compatible products amid the advancement of automotive electrification | Major | Medium | ||||
| ・Increase in revenue and profit from demand growth for enhanced core transmission network and power cables along with the expansion of renewable energy and growing electricity demand | Major | Medium | ||||
| Products and services | ・Increase in sales from demand growth for low-carbon and carbon-free products and recycled products in response to requests for carbon neutrality and circular economy | Medium to long term | Major | Medium | ||
| ・Technology development toward expanding introduction of next-generation energy | Long term | – | – | |||
| ・Technology development for expanding the implementation of photonics-electronics convergence | Long term | - | - | |||
We identify climate-related opportunities and risks and work to achieve carbon neutrality by both capturing revenue opportunities and mitigating risks. Based on the “Guidance on Metrics, Targets, and Transition Plans” published by TCFD in October 2021, we started formulating a climate transition plan which is a series of targets and actions to support the transition to a low-carbon economy in FY2023.
As for the measures to deal with risks, we revised the Environmental Vision 2050 in November 2024, setting a target of achieving GHG emissions across throughout the value chain. In addition, under our Environmental Targets 2030—established as a milestone toward 2050—we have set GHG reduction targets covering Scope 1, 2, and 3 emissions. Among these, the Scope 1 and 2 targets have been positioned as sustainability indicators under the risk-related material issue “developing business activities that consider climate change” in the 2025 Medium-term Plan, with specific goals set for FY2025.
As part of our climate transition plan to achieve the Environmental Vision 2050 and the Environmental Target 2030, we have established a roadmap to achieve zero GHG emissions (Scope 1&2) by 2050 and are promoting efforts to achieve these goals. In order to achieve our Scope 1&2 targets, it is essential not only to promote energy savings and fuel conversion at plants, but also to actively utilize renewable energy. Therefore, we have set the “Ratio of renewable energy use to total electricity consumption” as a sustainability indicator to work toward improving the ratio of renewable energy use (usage of hydroelectric power, installation of solar power system, and introduction of electricity derived from renewable energy.)
In an effort to reduce emissions across the entire value chain, we are working to calculate and understand our value chain emissions (Scope 3). For Scope 3 calculations, we follow the Basic Guidelines on Accounting for Greenhouse Gas Emissions Throughout the Supply Chain (ver. 2.6)” issued by the Ministry of the Environment and Ministry of Economy, Trade and Industry. Emission factor is referenced from the Emission Factor Database for Calculating Greenhouse Gas Emissions of Organizations Through the Supply Chain (ver. 3.3) and AIST-IDEA v3.3 (Japanese version).
Within our Group’s Scope 3 emissions, the highest contributing categories are Category 1: Purchased Goods and Services, and Category 11: Use of Sold Products. For Category 1 in particular, we are promoting the use of recycled materials such as copper, aluminum, and plastic, and are encouraging suppliers to calculate and reduce their GHG emissions. We are also working to understand emissions associated with purchased products through a dedicated questionnaire conducted alongside the Self-Assessment Questionnaire (SAQ) based on our CSR Procurement Guidelines.

As for the measures to deal with revenue opportunities, we will continue to stabilize revenue from existing businesses and develop a foundation for new business creation during the period of the 2025 Medium-term Plan. We will solve social issues in each business field and contribute to achieving carbon neutrality by 2030.
For example, the advancement of information and communications technology and the growing adoption of generative AI are expected to promote more sophisticated energy management and reductions in GHG emissions. At the same time, however, there are concerns about increased power consumption due to the expansion of data centers. The Group sees the growth of the data center market as a business opportunity. By supplying optical fiber and cable, and optical devices, we contribute to the realization of advanced communications infrastructure. Furthermore, to address the increasing heat generation of CPUs, GPUs, and other high-performance components that drive data center power consumption, we support energy efficiency through the provision of thermal management products such as AT products (high-thermal-conductivity tapes for semiconductor process), high-performance heat sinks, and heat pipes. We are also engaged in the research and development of photonics-electronics convergence technologies in preparation for future demands for greater bandwidth, lower latency, and reduced power consumption in the field of information and communications.
In the electric vehicle market within the mobility sector, we are contributing to the spread of low-carbon mobility by expanding the supply of lightweight aluminum wire harnesses as well as high-voltage components such as high-voltage wire harnesses and high-voltage junction boxes.
Meanwhile, the increasing electricity consumption in both the information and communications and mobility sectors is driving a growing need in the energy sector for the decarbonization of the power industry—through the expansion of renewable energy—and the reinforcement of core power transmission networks. We are closely monitoring developments in Japan’s energy policy, including the 7th Strategic Energy Plan, and supporting the growth of offshore wind power and the development of next-generation power networks through the supply of power cables. In parallel, we are advancing R&D and new business creation, including the development of high-temperature superconducting wire for nuclear fusion power generation and the establishment of mass production technologies for green LPG*.
* Green LP gas:LP gas produced from biogas (a mixture of methane gas, which is from the fermentation of animal manure and food waste, and carbon dioxide).
We have set “GHG emissions reduction rate (Scopes 1&2)”, “Ratio of renewable energy use to total electricity consumption” and “Sales ratio of environment-friendly products” as sustainability indicators that measure the progress of addressing material issues of “Developing business activities that consider climate change” and “Creating environment-friendly businesses.” Sustainability Committee follows up the progress of these indicators semiannually. We have also set the GHG emissions targets for each business division in accordance with the Targets 2030 since FY2020, and GHG emissions per unit of sales targets for each business division since FY2022. Management Committee follows up the progress of “GHG emissions” and “GHG emissions per unit of sales” quarterly.
As for internal carbon pricing (using a shadow price), setting GHG emissions of each business division calculated using carbon prices (applying 20,000 yen/t-CO₂e in FY2024) since FY2019, we encourage each business division to be prepared to avoid climate change risks for decarbonization based on the quarterly evaluation and posting effects at the Environmental Committee. In addition, formulating of a renewable energy introduction plan is being promoted for any division that does not meet the target, having established a rule that each business division will bear the increase in procurement costs of renewable energy if the targets are not met since FY2023.
In addition to financial factors, we utilize ESG factors, “GHG emissions” and “GHG emissions per unit of sales (carbon efficiency),” in the process of business portfolio optimization and calculating the cost of capital in FVA for each business. In risk management of the entire Group, we identify “Climate Change (Carbon Neutral)” as a material risk from management perspectives and address it accordingly.
Environmental Vision 2050 embraces the contribution to the realization of a sustainable society throughout the value chain through the provision of environment-friendly products and services and recycling-based production activities. As part of our contribution to the realization of a carbon-free society, we aim to achieve net-zero GHGs emissions across our entire value chain.
We have set the Environmental Targets 2030, a milestone toward the realization of the Environmental Vision 2050. To contribute to the realization of a carbon-free society, we identify our 2030 target as follows.
(1) Greenhouse gas emissions from business activities (Scopes 1&2): Reduce by at least 42% compared to FY2021
(2) Greenhouse gas emissions in the value chain (Scope 3): Reduce by at least 25% compared to FY2021
Scope 1: Direct emissions from own factories and offices
Scope 2: Indirect emissions from the use of electricity, heat, etc. purchased by the company
Scope 3: Indirect emissions other than Scopes 1 and 2 (emissions by other companies related to the activities of the business operator)
Environmental Policy/Medium- to Long-term Vision and Targets
Furukawa Electric Group’s GHG reduction targets of 2030 obtained SBT (Science Based Targets) below 1.5℃ certification in July 2023. This certifies that our Group’s targets are based on scientific evidence in achieving the “efforts to limit the temperature increase to 1.5℃ above re-industrial level” aimed in the Paris Agreement*.
* Paris Agreement: An international agreement adopted at the Conference of the Parties to the United Nations Framework Convention on Climate Change (UNFCCC) in 2015 (COP21) to reduce greenhouse gas emissions and other emissions in and after 2020.

In FY2024, we further promoted the introduction of renewable energy which we have been actively promoting since FY2022. At the Mie No. 1 Plant, which manufactures AT products, we switched 100% of our electricity consumption to renewable energy as of April 2023. In addition, at the newly established Mie No. 2 Plant in May 2024, we installed solar power generation facilities on the rooftop using an on-site PPA model. By covering part of the electricity used with solar power, we expect to contribute to reducing GHG emissions during the manufacturing of AT products. We also promote to install solar power systems and switch to procuring renewable energy in other business sites of our company and production sites in Japan and overseas. As a result, we expect to achieve the FY2024 targets, “GHG emissions reduction rate (Scope 1&2)” and “Ratio of renewable energy use to total electricity consumption.
| Metrics ★:Sustainability indicators |
Scope | base year | Result | Target (Reference value) | Vision | ||||
|---|---|---|---|---|---|---|---|---|---|
| FY2022 | FY2023 | FY2024 | FY2024 | FY2025 | FY2030 | FY2050 | |||
| ★Sales ratio of environmentally friendly product | Group | - | 65.0% | 65.9% | 74.0% | 68% | 70% | - | - |
| ★GHG emissions reduction rate (Scope 1 and 2)*1 | Group | 2017 | -36.8% | -45.4% | - | (-39%) *2 | (-42%) *2 | (-59%) *2 | Net zero emissions |
| 2021 | - | - | -34.8% | -14.0% | -18.7% | -42% | |||
| GHG emissions reduction rate (Scope 3) | Group | 2019 | -6% | -11.3% | - | - | - | - | |
| 2021 | - | - | -8.8% | -8.3% | -11.1% | -25% | |||
| ★Ratio of renewable energy use to total consumption | Group | - | 20.2% | 31.6% | 39.6% | 25% | 30% | 50% | - |
*1The greenhouse gas emissions produced by our Group are mainly energy-derived carbon dioxide (CO₂) and sulfur hexafluoride (SF₆).
*2Starting from FY2024, base year is updated to FY2021; the reduction target value when applied to the former base year of FY2017 is also shown for reference purposes.
Sustainability Indicators and Targets
| Greenhouse Gas Emissions Throughout the Value Chain (Scope 1, 2 and 3) | Unit | Scope | FY2020 | FY2021 | FY2022 | FY2023 | FY2024 | ||
|---|---|---|---|---|---|---|---|---|---|
| Scope 1 | CO₂ | 1,000t-CO₂e | Furukawa Electric + Domestic group companies + Overseas group companies |
115 | 121 | 116 | 105 | 96 | |
| SF₆ | 28 | 7 | 37 | 42 | 12 | ||||
| 1,000t-CO₂e | 143 | 128 | 153 | 147 | 108 | ||||
| Scope 2 | 1,000t-CO₂e | 504 | 512 | 418 | 346 | 309 | |||
| Scope 1 and 2 | 647 | 640 | 571 | 493 | 417 | ||||
| Scope 3 | Upstream | Category 1:Purchased goods and services* | 1,000t-CO₂e | Furukawa Electric + Domestic group companies + Overseas group companies |
1,656 | 1,829 | 1,855 | 1,820 | 1,605 |
| Category 2:Capital goods | 158 | 134 | 154 | 137 | 136 | ||||
| Category 3:Fuel- and energy-related activities (not included in Scope 1 or Scope 2)* | 94 | 123 | 110 | 102 | 97 | ||||
| Category 4:Upstream transportation and distribution* | 126 | 207 | 323 | 211 | 222 | ||||
| Category 5:Waste generated in operations | 21 | 22 | 18 | 16 | 18 | ||||
| Category 6:Business travel* | 6 | 57 | 12 | 13 | 7 | ||||
| Category 7:Employee commuting | 23 | 24 | 24 | 25 | 24 | ||||
| Category 8:Upstream leased assets | 6 | 7 | 9 | 6 | 9 | ||||
| Downstream | Category 9:Downstream transportation and distribution* | 1,000t-CO₂e | 9 | 141 | 9 | 23 | 21 | ||
| Category 10:Processing of sold products | ― | 17 | 16 | 14 | 18 | ||||
| Category 11:Use of Sold Products* | 1,980 | 1,575 | 1,587 | 1,482 | 1,682 | ||||
| Category 12:End-of-life treatment of sold products* | 51 | 57 | 63 | 81 | 92 | ||||
| Category 13:Downstream leased assets | 3 | 4 | 4 | 3 | 4 | ||||
| Category 14:Franchises | ― | ― | ― | ― | ― | ||||
| Category 15:Investments* | 28 | 283 | 274 | 267 | 152 | ||||
| 1,000t-CO₂e | 4,161 | 4,480 | 4,458 | 4,200 | 4,087 | ||||
| Scope 1, 2 and 3 | 4,808 | 5,120 | 5,029 | 4,693 | 4,504 | ||||
*The calculation method was reviewed in FY2023 and recalculated retroactively for FY2021